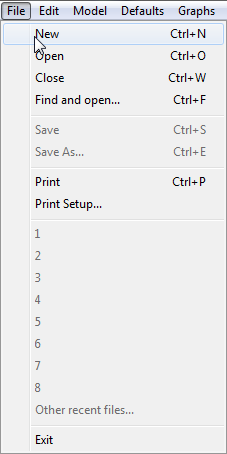
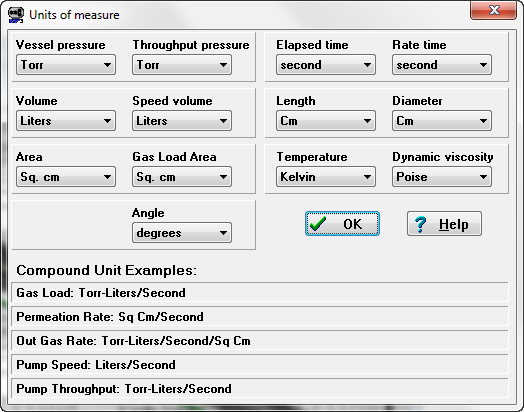
The File menu contains common file management commands, which are used in the same manner as most Windows programs. In addition, most recently opened files are listed. Open recent files… displays a list of recent files that have been opened.
|
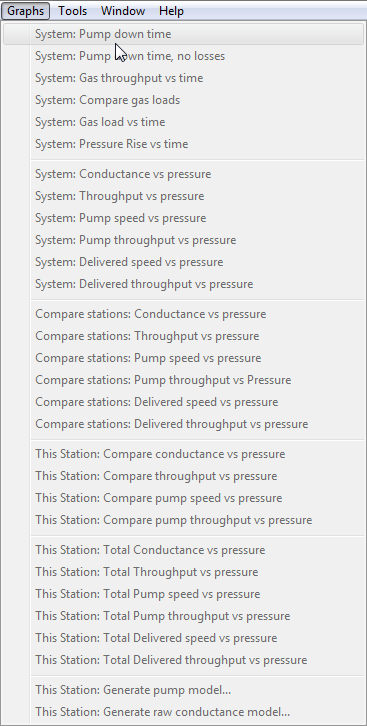
The Graphs menu contains most of the graphing options in VacTran for System models, Pump models, Raw data gas load models, Raw data conductance models, Simple systems and Conductance Studies. Graph commands will be active when a displayed model has enough data in it.
|
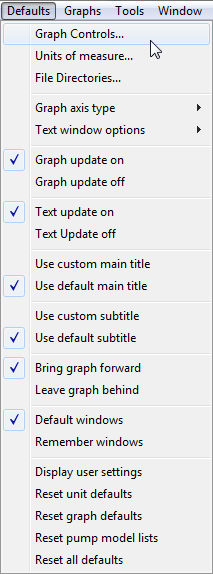
Each type of graph has a unique axis setting, which can be changed at any time using Graph Controls under the Defaults menu.
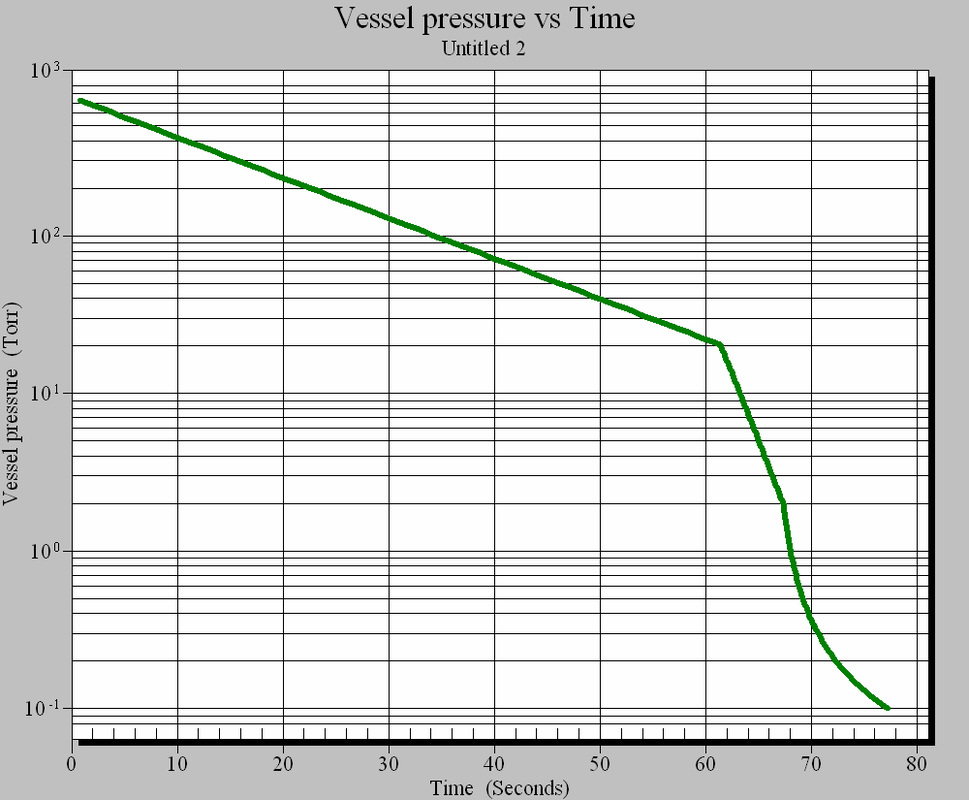
Any graph can be copied and pasted to a file, clipboard, or another graph window on the screen. Complete scaling and orientation options are available by selecting the Export button on the Main Graph Window. An example of a pump down graph is shown below: |
|
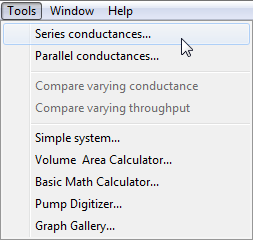
The Tools menu activates one of the conductance studies, the Simple System Study
|
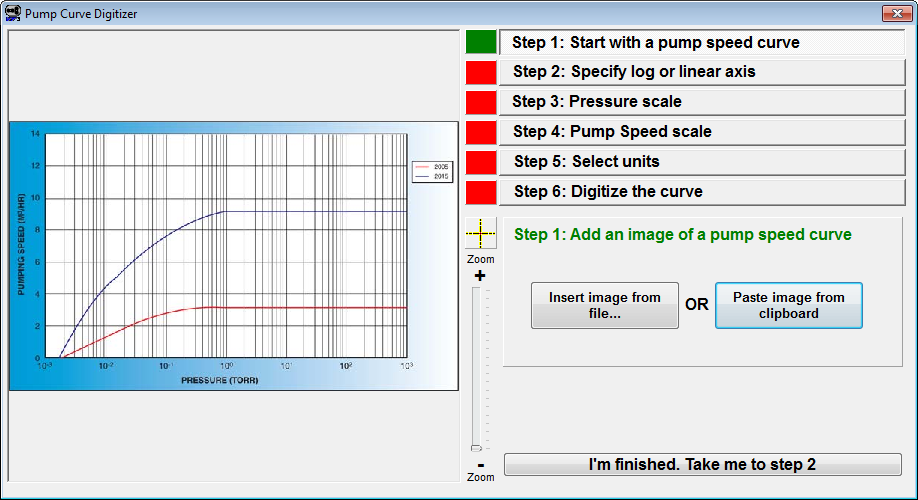
Pump models can be created by copying and pasting pump curve images into this tool, and then digitizing the curve point by point after setting up the scaling points. This is considerably faster than trying to read points and entering them manually.
To access this function from the tool buttons, use the following short cut: |


